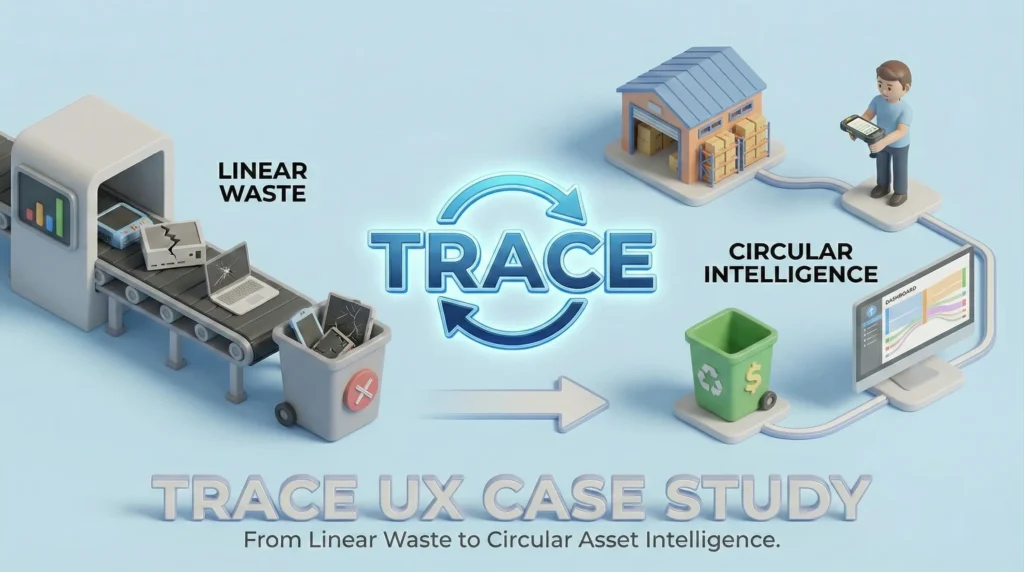
The Circular Asset Intelligence Platform
This case study is actively being documented.
PROJECT
Trace
ROLE
Lead UX Designer
STAGE
MVP / Ongoing Iteration
Platform: Mobile (Ruggedized Android/iOS) & Desktop Web
The ‘Elevator Pitch’: Trace is a B2B asset lifecycle engine that helps enterprises move from linear consumption (Buy → Use → Trash) to circular intelligence (Buy → Optimize → Recover Value).
1. Executive Summary & The Problem Space
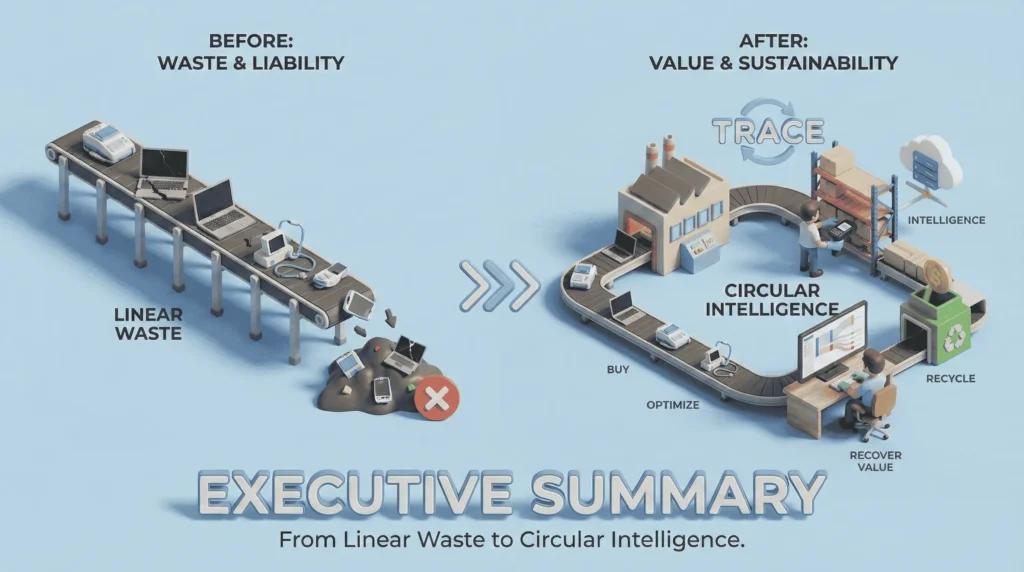
Large enterprises (hospitals, manufacturing hubs, tech campuses) sit on millions of dollars in physical assets, laptops, specialized medical tools, and machinery.
The Core Problem:
Currently, asset tracking is fragmented. Procurement buys it, IT deploys it, and Operations uses it. But when an asset breaks or becomes obsolete, it vanishes into storage closets or landfills. This creates three major issues:
- Ghost Assets
Paying taxes and insurance on equipment that doesn’t exist or is unusable. - Operational Friction
Staff cannot locate tools when they need them. - ESG Failure
Companies miss sustainability targets because they cannot prove they recycled their electronics responsibly.
The Vision:
To build a ‘System of Truth’ that connects the dots between a purchase order and a recycling certificate.
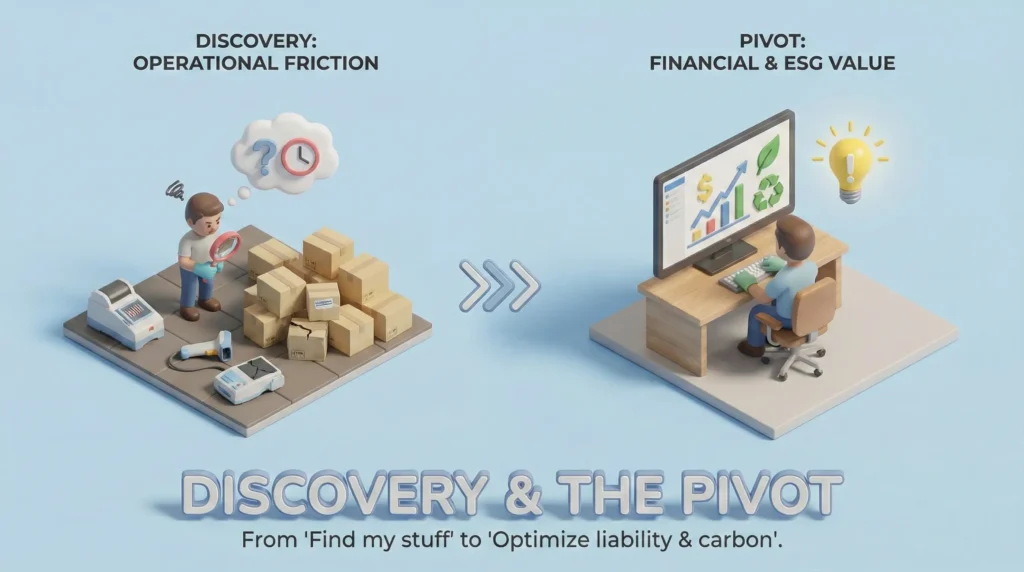
2. Discovery & The Pivot (The Aha! Moment)
This section demonstrates your strategic thinking and willingness to kill bad ideas.
The Initial Hypothesis
“If we build a slicker, faster barcode scanner than the existing clunky ERPs, warehouse staff will scan everything, and we will have 100% inventory accuracy.”
The Research: Contextual Inquiry
I spent three days shadowing warehouse staff and IT procurement officers at a mid-sized tech logistics center.
- Observation
The staff hated scanning. It was viewed as ‘feeding the beast’.
They were overworked, wearing gloves, and dealing with bad Wi-Fi. - The Barrier
The bottleneck wasn’t the software speed; it was the lack of incentive. - The Stakeholder Interview
I talked to the CFO. He didn’t care about ‘knowing where the laptop is’.
He cared that he was legally liable for the data on the hard drive and the carbon tax associated with its disposal.
The Strategic Pivot
We moved from an Inventory Tracker (Operational focus) to a Compliance & Resale Engine (Financial/ESG focus).
- Before
Find my stuff. - After
Optimize my tax liability and carbon score. - UX Implication
We stopped optimizing for search and started optimizing for chain of custody and condition grading.
3. Systems Thinking & User Personas
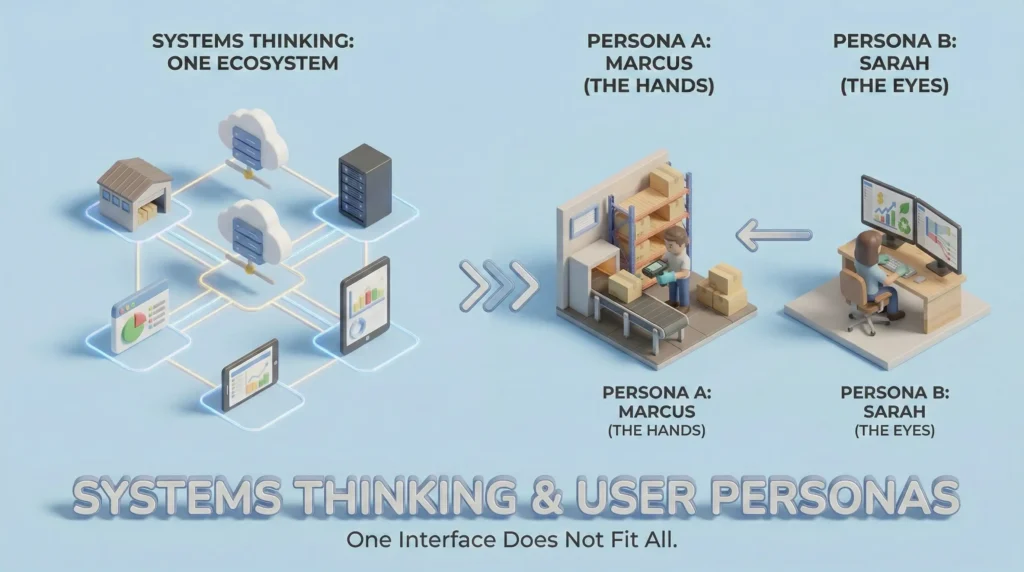
A circular system requires different interfaces for different environments. One interface does not fit all.
The Ecosystem Map
- Input Layer (The Hands): Warehouse/Floor. High-contrast, large touch targets, offline-first.
- Logic Layer (The Brain): Cloud Database connecting to ERPs (SAP/Oracle) via API.
- Output Layer (The Eyes): Desktop Dashboard for Finance & Sustainability officers.
Persona A: Marcus – The Operations Specialist
- Context: Noisy warehouse, spotty Wi-Fi, wears safety gloves.
- Goal: Get the intake done so he can go on break.
- Pain Point: “If I have to tap 12 times to log one laptop, I’m not going to do it.”
- UX Strategy: Hyper-efficiency. Haptic feedback, Batch Scan modes, and voice-to-text for notes.
Persona B: Sarah – The VP of Sustainability
- Context: Quiet office, dual monitors, preparing quarterly reports for the board.
- Goal: Reduce carbon footprint and recover budget from resale.
- Pain Point: “I have data spread across 50 spreadsheets. I can’t calculate our scope 3 emissions.”
- UX Strategy: Data Visualization. Aggregated dashboards, Red Flag alerts for expiring assets.
4. UX Strategy: Solving for Data Integrity
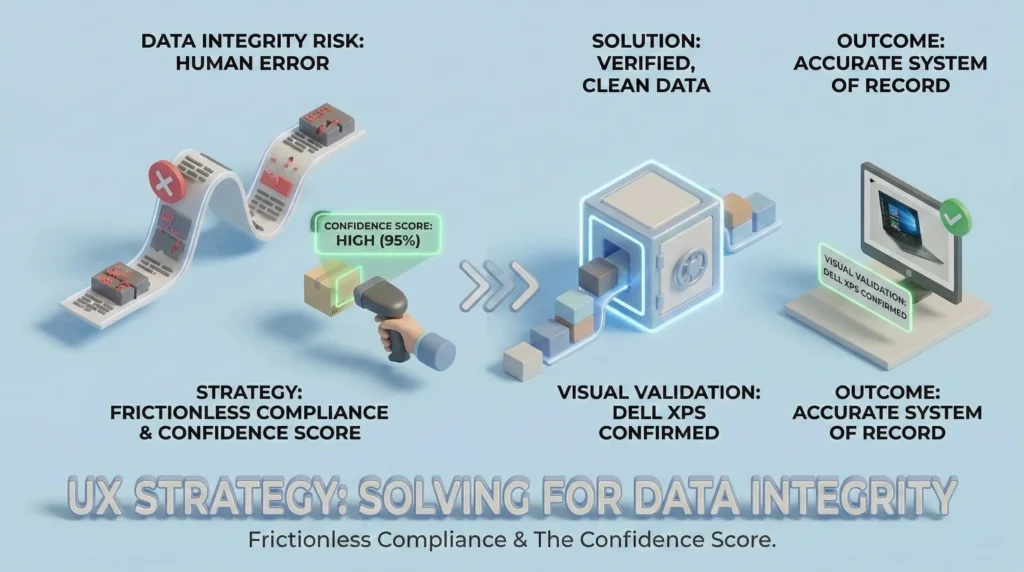
The biggest risk to this product is human error. If the data entering the system is bad, the reports are useless.
Design Solution: Frictionless Compliance
To ensure data integrity without slowing Marcus down, I implemented:
- Progressive Disclosure
Don’t ask for all data at once. Ask for the Serial Number first.
If the system recognizes it from the Procurement API, auto-fill the rest. - The Confidence Score
If a user manually enters data that looks weird (e.g., a laptop marked as New but the photo shows cracks), the system flags it for review rather than rejecting it outright (which frustrates the user). - Visual Validation
When a barcode is scanned, the app instantly flashes a photo of what the item should look like. “Is this a Dell XPS?” -> User taps ‘Yes’
5. Workflows & Journey Mapping
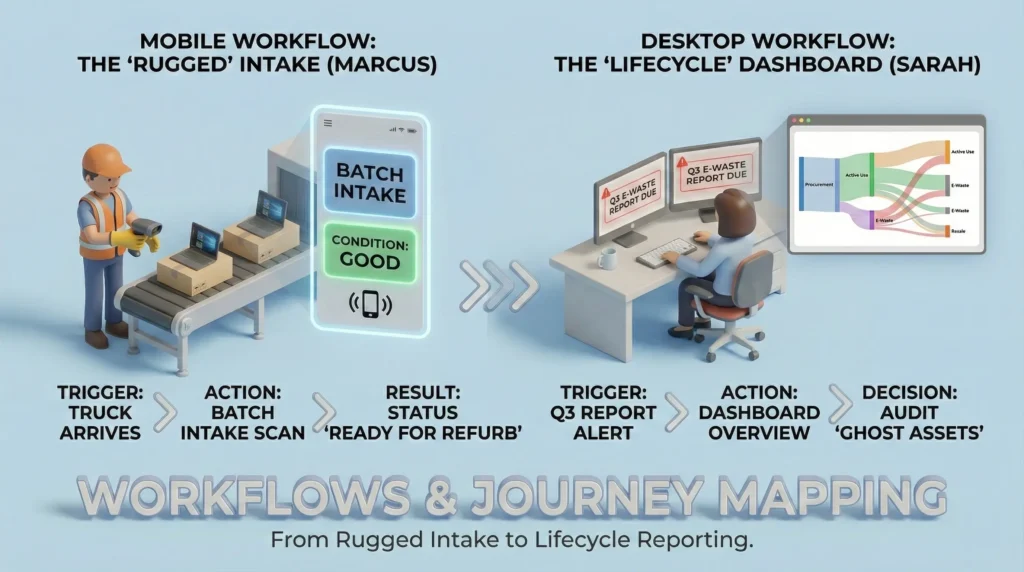
Mobile Workflow: The Rugged Intake (Marcus)
- Device: Zebra Scanner / Android Rugged
- UI Style: Dark mode (battery saving), High Contrast Yellow/Black, Typography size 18pt+.
- Trigger: Truck arrives with 50 used laptops.
- Action: Marcus opens ‘Batch Intake’.
- Interaction:
- Point & Shoot (Camera scans barcode).
- Haptic Buzz (Success).
- System Logic: Checks database. ‘Asset #445 found. Expected condition: Good’.
- Prompt: ‘Is screen cracked?’ (Two giant buttons: YES / NO).
- Action: Marcus taps ‘NO’
- Result: Item status updated to ‘Ready for Refurb’.
Desktop Workflow: The Lifecycle Dashboard (Sarah)
- Device: Desktop Web
- UI Style: Clean, White/Grey, Data-dense tables, Sankey Diagrams.
- Trigger: Sarah gets an alert ‘Q3 E-Waste Report Due’.
- Action: Dashboard Overview.
- Visualization: A Sankey diagram showing asset flow:
- Input: $5M Purchasing.
- Active: $3M in use.
- At Risk: $500k in Ghost Assets (haven’t pinged network in 90 days).
- Output: $200k Recovered via Resale | 5 Tons CO2 Saved.
- Decision: Sarah clicks Ghost Assets, selects all, and pushes a ‘Request Audit’ notification to the relevant department heads.
6. The Sticky Factor
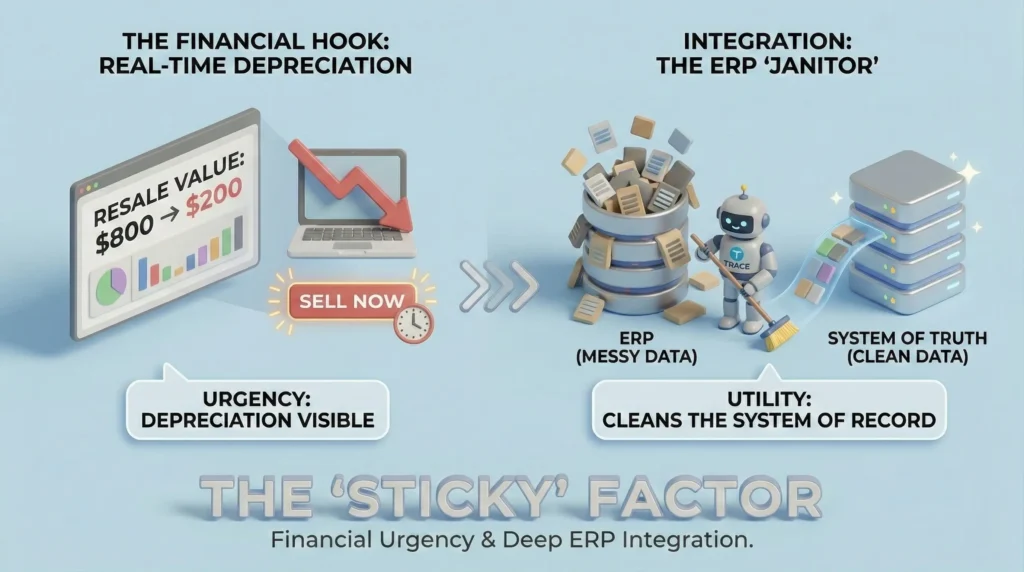
Why does this system stick when others fail?
- The Financial Hook
We show the Resale Value ticker in real-time.
Seeing a laptop depreciate from $800 to $200 creates urgency. - Integration
It doesn’t replace the ERP; it cleans the ERP.
We push clean data back to their main system, making Trace the janitor of their data.
7. Current Status & Next Steps (Work in Progress)
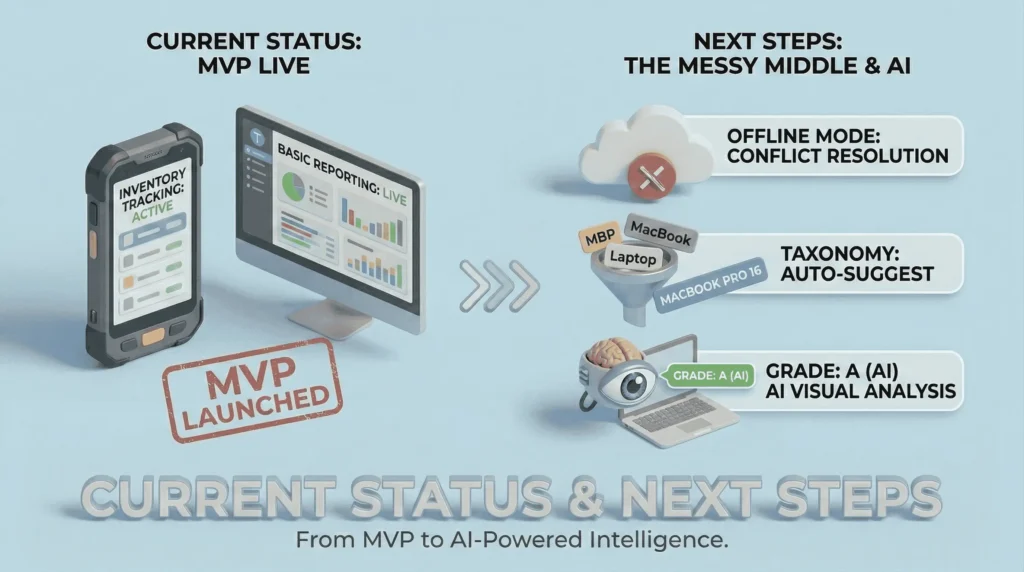
Current State (MVP):
- Mobile scanning and basic desktop reporting are live.
- Inventory tracking is functional.
The ‘Messy Middle’(Challenges I am solving now):
- Offline Mode: Handling data conflict when two users scan the same item while offline.
- Taxonomy: Normalizing data. (User A types ‘MacBook Pro’, User B types ‘MBP 15’). Designing an auto-suggest tagging system to fix this.
Next Steps:
- AI Visual Analysis: Testing a feature where the user photographs the asset, and Computer Vision estimates the Grade (A, B, or C) to remove subjective human bias.