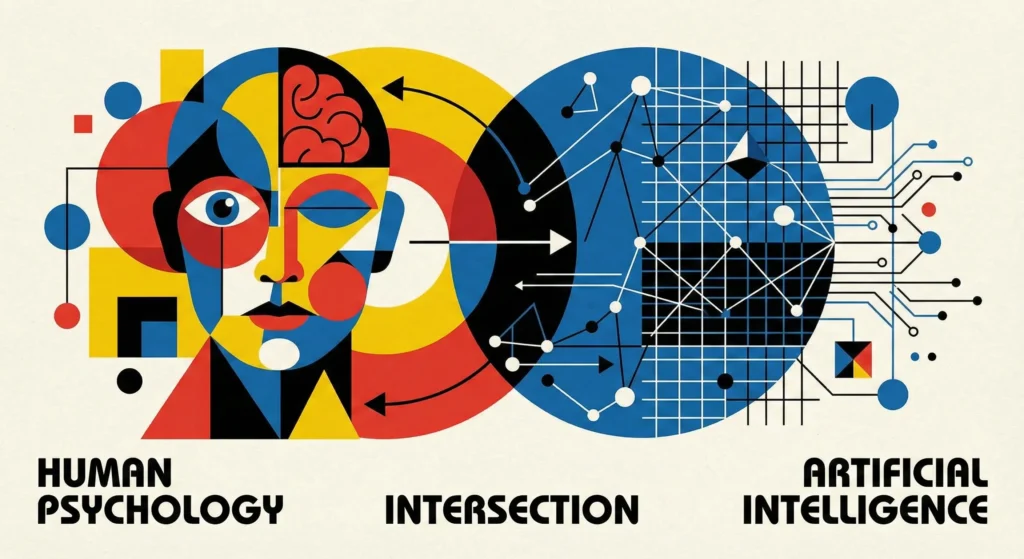
Bridging the gap between qualitative human behavior and quantitative machine learning in gaming
This is a case study of a whitepaper Predictive Behavioral Modeling in Game UX Strategy.
READ THE COMPLETE WHITEPAPER
Project
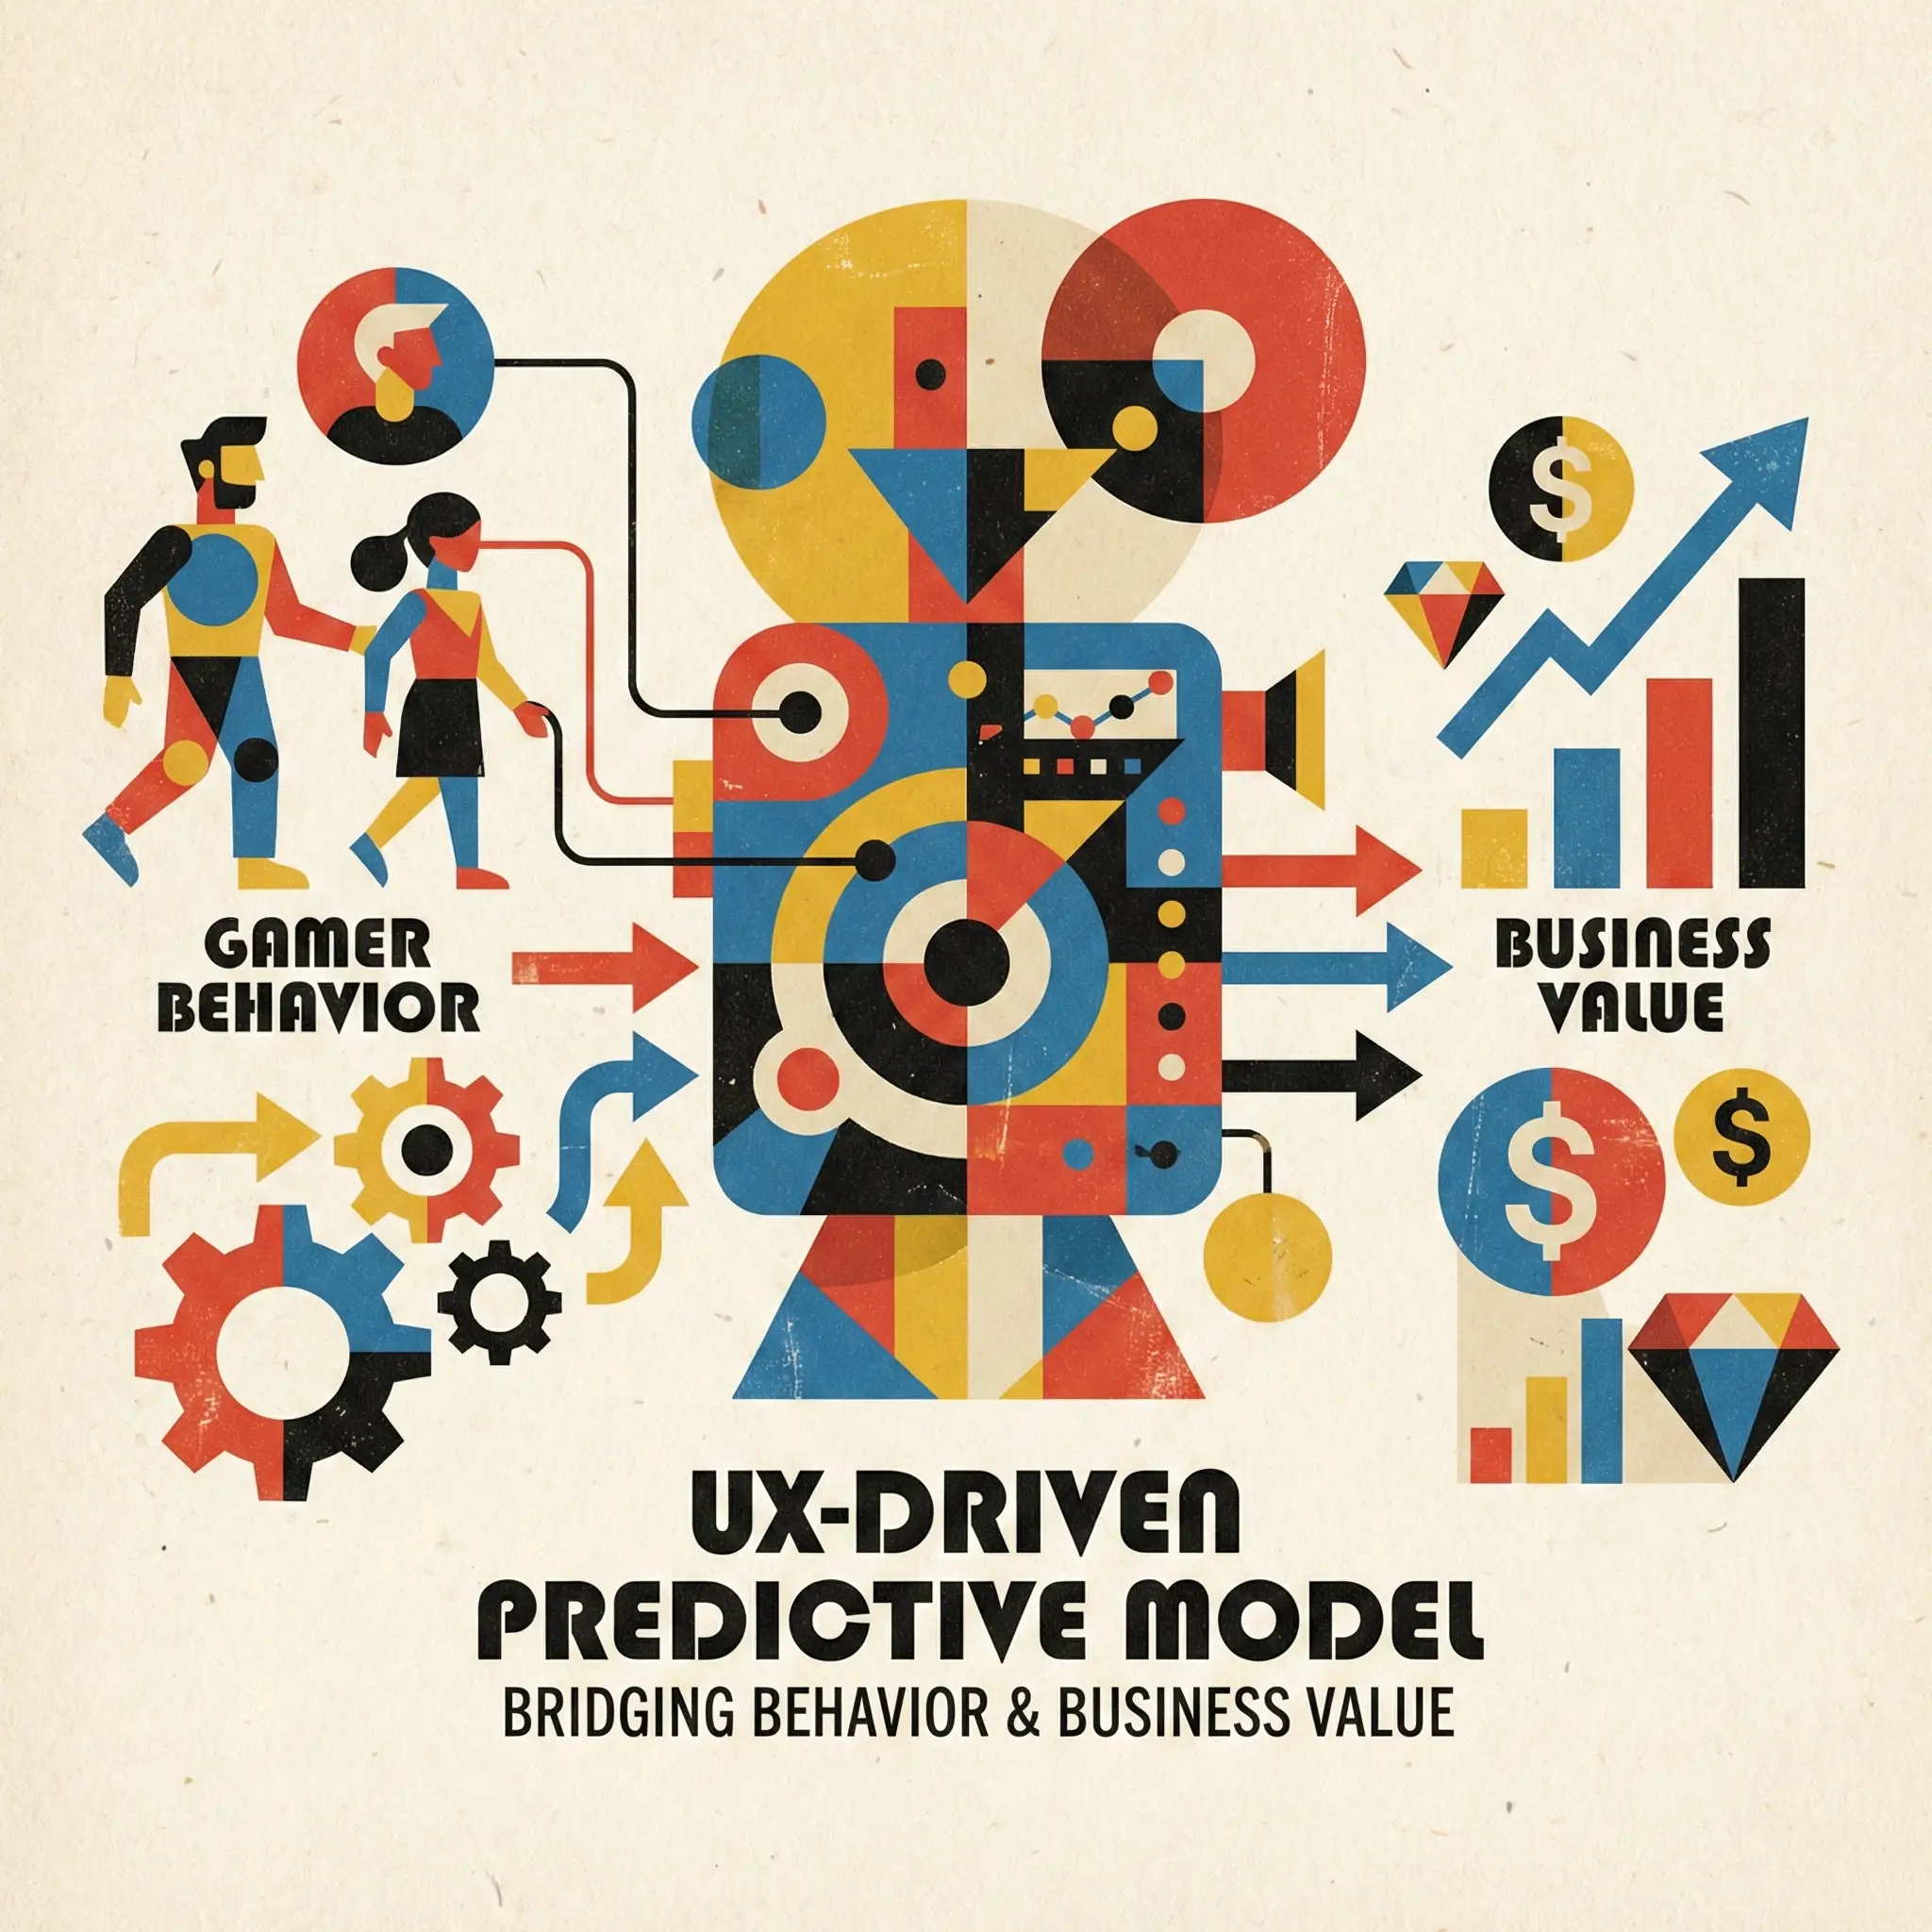
Predictive Behavior Model
Timeline, YEAR
2018-2022
ROLE
UX Strategy Lead / Framework Architect
Core Competencies
Data-Driven Design, Cross-Functional Leadership, AI & ML Strategy
Outcome
A scalable framework that increased retention accuracy and optimized monetization through personalized, ethical interventions.
1. The Challenge: The ‘Black Box’ Problem
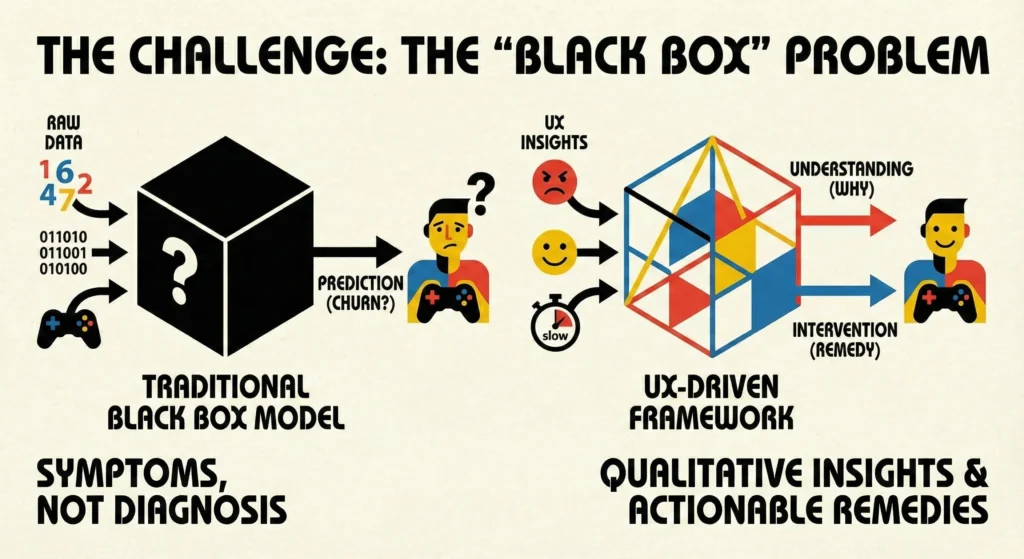
Traditional predictive modeling in gaming has historically relied on ‘black box’ statistical approaches or raw game logs (e.g., session counts, spending history). While these models could forecast what a player might do (like churn), they failed to explain why.
As a UX leader, I identified a critical blind spot: Data Science was measuring the symptoms, but Design held the diagnosis. We needed a way to operationalize ‘frustration’, ‘delight’, and ‘confusion’ into numeric features that machine learning models could actually use.
2. The Hypothesis
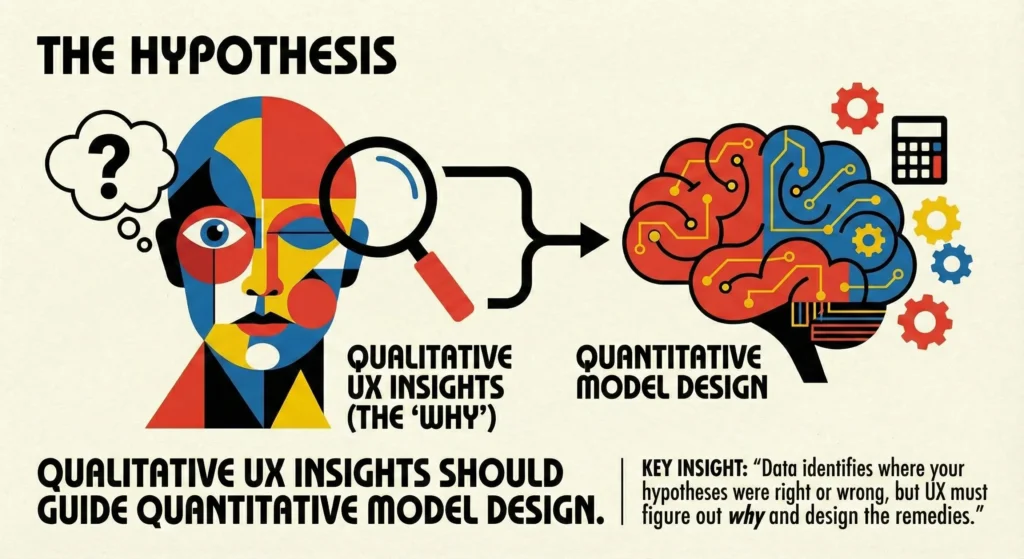
‘Qualitative UX insights should guide Quantitative Model Design.’
We proposed a UX-driven hypothesis: integrating user experience metrics (e.g., friction in onboarding, navigation fluidity, social engagement) into predictive models yields richer actionable insights than raw telemetry alone.
Key Insight: “Data identifies where your hypotheses were right or wrong, but UX must figure out why and design the remedies.”
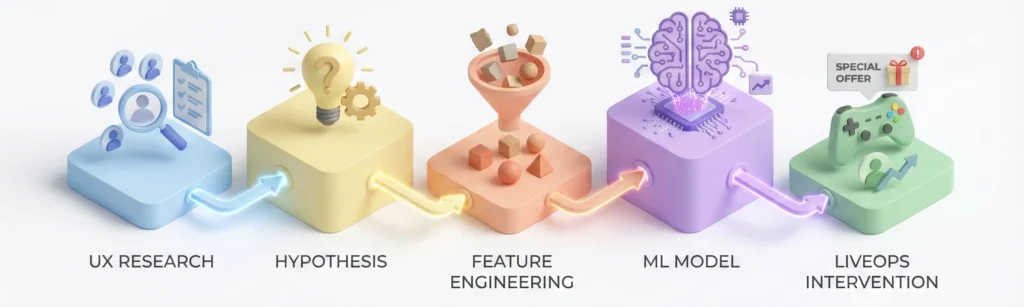
3. The Solution: A Unified Framework
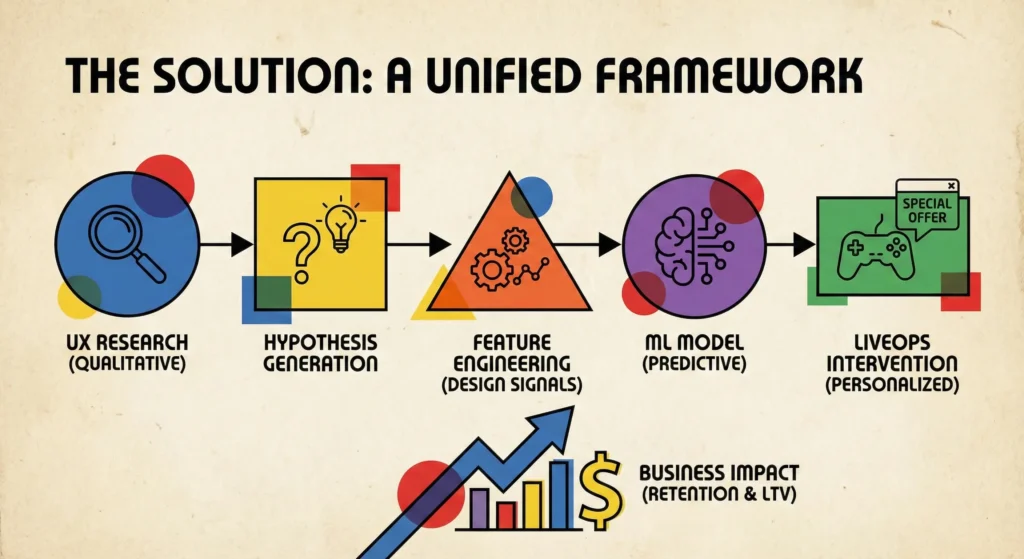
I orchestrated a collaboration between UX, Product, and Data Science to build a robust architecture that treats ‘User Experience’ as a measurable data pipeline.
Phase 1: Feature Engineering (The ‘Design’ Signal)
We moved beyond generic metrics (Session Length, DAU) to specific UX Features designed to capture sentiment and friction:
- Frustration Signals: ‘Rage taps’ in menus or unusual drop-offs between tutorial steps.
- Cognitive Load: Time spent on specific help screens or tutorial retries.
- Social Velocity: The ratio of social actions (gifts/invites) to gameplay progression.
Phase 2: The Architecture
We utilized a modern cloud infrastructure (AWS/GCP) to ingest these UX signals in real-time alongside standard game events.
- Input: Game client emits event logs + UX instrumented tags.
- Processing: Deep learning models (Attention-based nets) process sequential player data.
- Output: Real-time propensity scoring for Churn and Lifetime Value (LTV).
4. Application & Impact
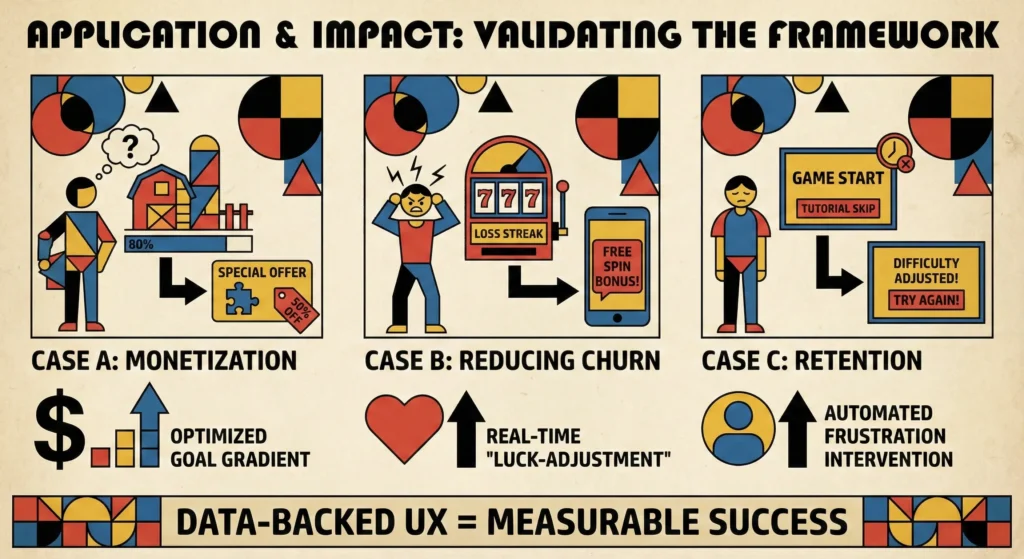
We validated this framework across different game genres, proving that UX context significantly improves model performance and business outcomes.
Case A: Driving Monetization in ‘Social Buildables’ (FarmVille Style)
- The UX Insight: Players rarely paid for the start of a task, but were highly motivated to pay for the last few pieces to complete a ‘buildable’.
- The Model: We tracked ‘Friend Network Contribution Rate’ and ‘Task Completion %’
- The Intervention: When a player hit 90% completion on multiple tasks, the model triggered a customized offer, capitalizing on the ‘Goal Gradient’ psychological effect.
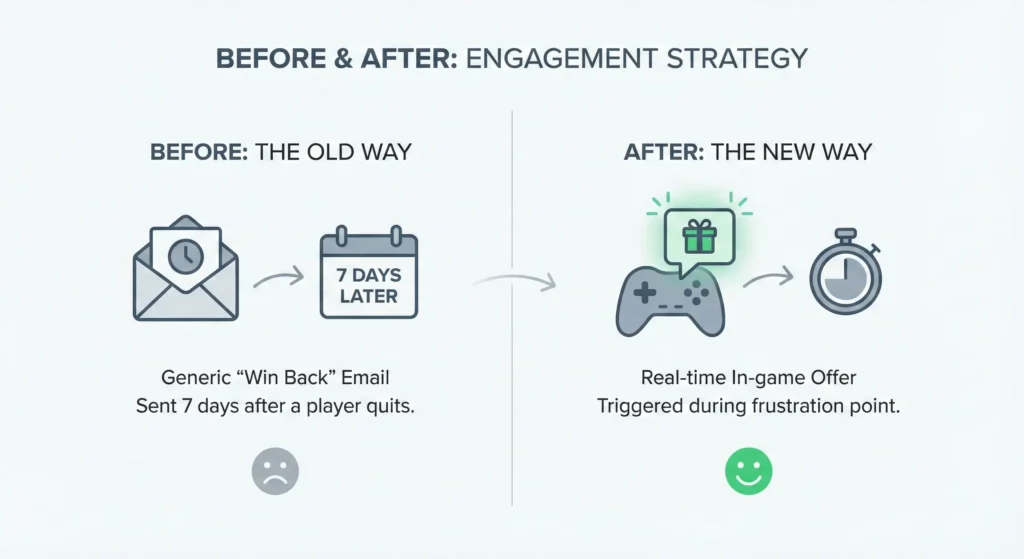
Case B: Reducing Churn in Casino/Slots
- The UX Insight: High-value players often churn after ‘bad luck’ streaks or confusing UI interactions with new features.
- The Model: Monitored ‘Diminishing Returns’ on bets and ‘abandoned UI launches’ (e.g., opening a tournament window but closing it without playing).
- The Intervention: Real-time personalized bonuses or ‘luck-adjustment’ incentives sent before the player left the session.
Case C: Retention in Hyper-Casual
- The UX Insight: In ad-driven games, players drop off immediately if the ‘First Time User Experience’ (FTUE) is too slow or the restart loop is clunky.
- The Model: Correlated ‘Tutorial Skip’ behavior with Day-1 Retention.
- The Intervention: Automated difficulty adjustments and ‘Replay Prompts’ shown only to players exhibiting frustration signals.
5. Ethical Leadership
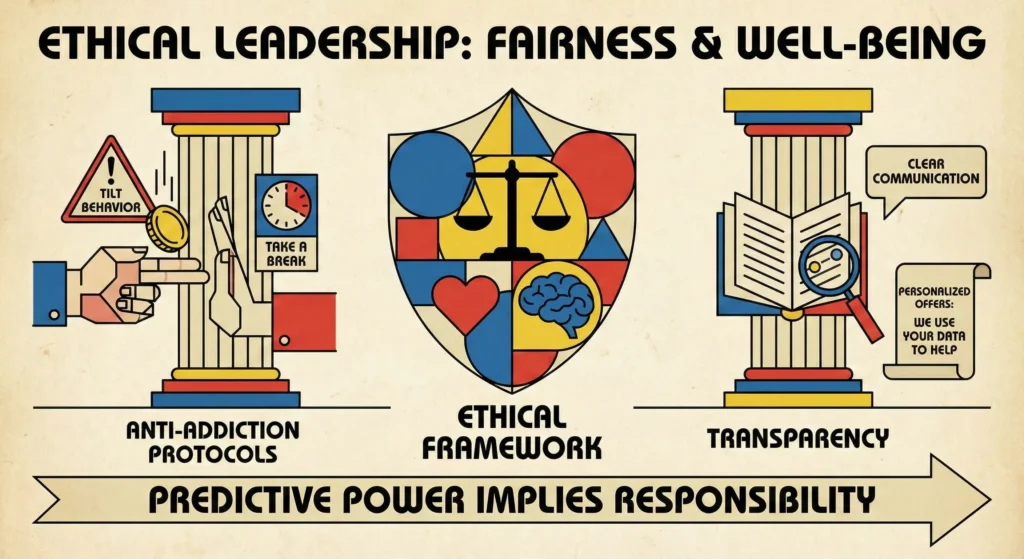
As a leader, I established that predictive power implies responsibility. We built ‘Fairness and Well-being” guardrails directly into the system.
- Anti-Addiction Protocols: If the model flagged high spending coupled with ‘diminishing returns’ (tilt behavior), the system suggested breaks or self-exclusion rather than pushing more bonuses.
- Transparency: We advocated for clear communication in privacy policies, ensuring players understood that offers were personalized based on their usage patterns.
6. Results
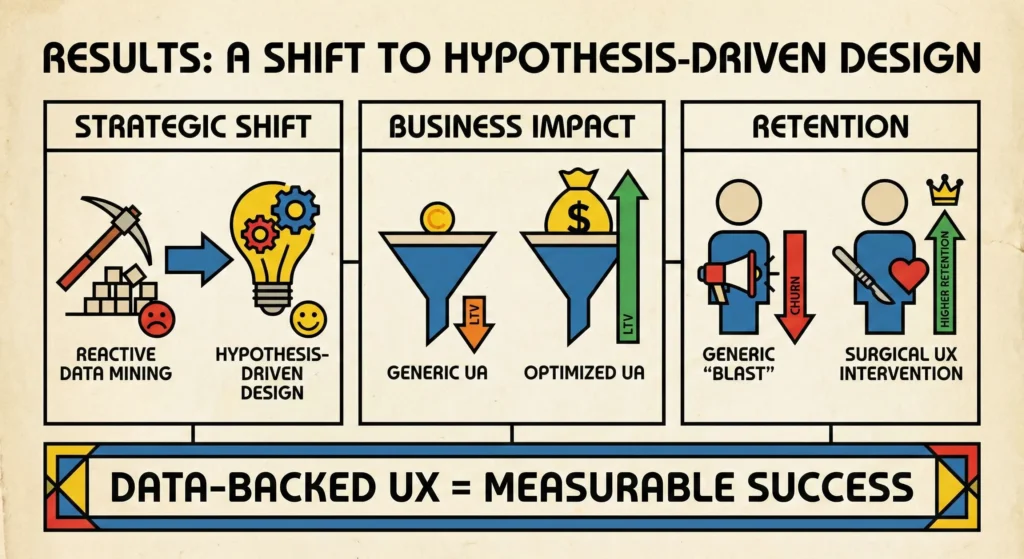
- Strategic Shift: Moved the organization from ‘reactive data mining’ to ‘hypothesis-driven design’.
- Business Impact: Optimized User Acquisition budgets by predicting LTV earlier, allowing marketing to target high-value users more efficiently.
- Retention: Achieved higher retention rates by replacing generic ‘blast’ campaigns with surgical, data-backed UX interventions.